
Vizualize This! Competition
October 2, 2019 in frontpage, news
Visualize This! invites researchers from all disciplines to use their own datasets — or our sample dataset — to build a unique and innovative visualization that displays an interesting aspect of the data.
Visualize What?
Now in its fourth year, Visualize This! invites researchers from all disciplines to use their own datasets — or our sample dataset — to build a unique and innovative visualization that displays an interesting aspect of the data. Our panel of judges will review all entries, and prizes will be awarded to the best submissions.
The theme of this year’s challenge is Distributed Rendering — the visualization of very large datasets that require parallel rendering on a cluster.
Visualize This! is open to anyone affiliated with a Canadian post-secondary institution (college or university) or research organization. Participants from all research fields are encouraged to enter.

Ways to Participate:
1. Use Your Own Dataset
Use data from your own research. Any dataset that is too large to be rendered on a standalone desktop/workstation will be sufficiently large for this competition.
2. Use Our Dataset
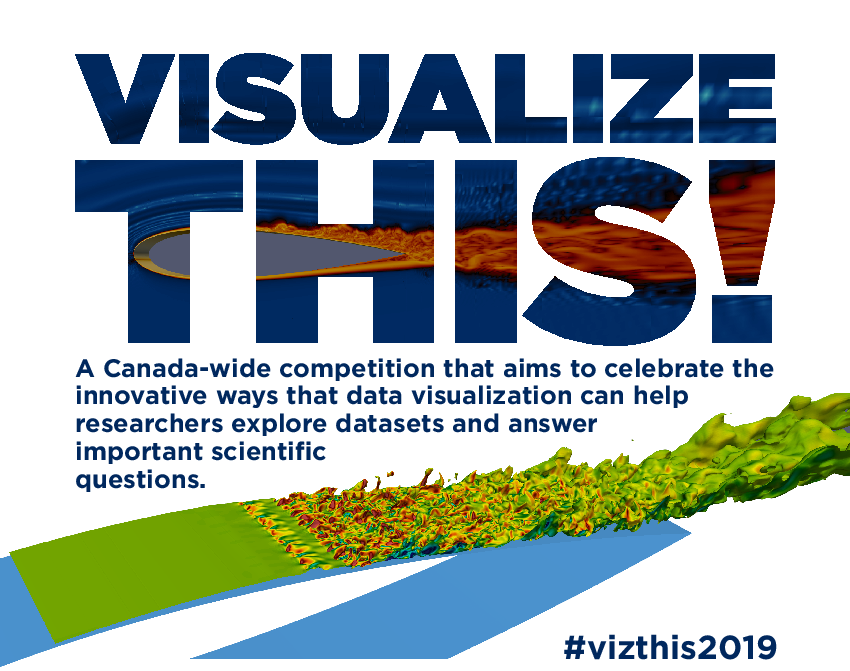
If you don’t have a large enough dataset from your own work, Joshua Brinkerhoff from UBC Okanagan will be supplying a 3D Computational Fluid Dynamics (CFD) dataset that can be used for this competition. Example visualizations of this data are featured in the imagery on this poster. Joshua’s data will be available from September 30.
Submissions Due:
November 30, 2019
For more information email viz-challenge AT westgrid.ca or visit: https://computecanada.github.io/visualizeThis.